使用 Canvas 绘制地图
AI 摘要salmon-ai
本文详细解析了如何使用 Canvas 绘制地图,包括获取 Ge
前言
在我们的大屏可视化项目中,地图数据可视化是最常见功能。地图数据可视化目前的实现方案有很多,其中最具有代表性的莫过于使用echarts,引入一个 js 文件,再加上一些简单的配置,这样一个地图就展示出来了。
虽然我是一名 Java 程序员,但是保持着对于更多技术的学习,我们也要了解下他的思实现方式。
下面我将使用 Canvas 简单绘制一下地图。
教程
1、获取地图数据
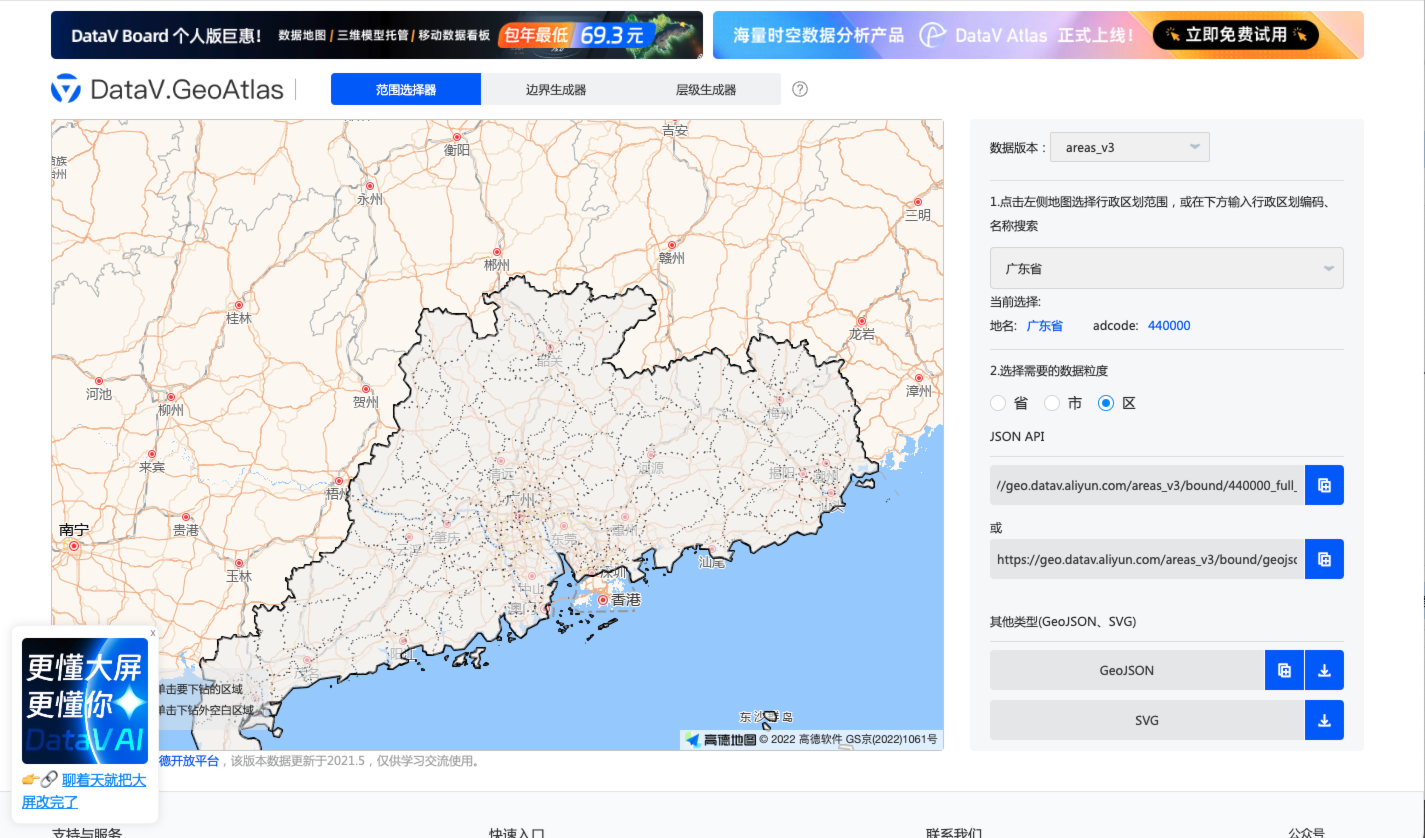
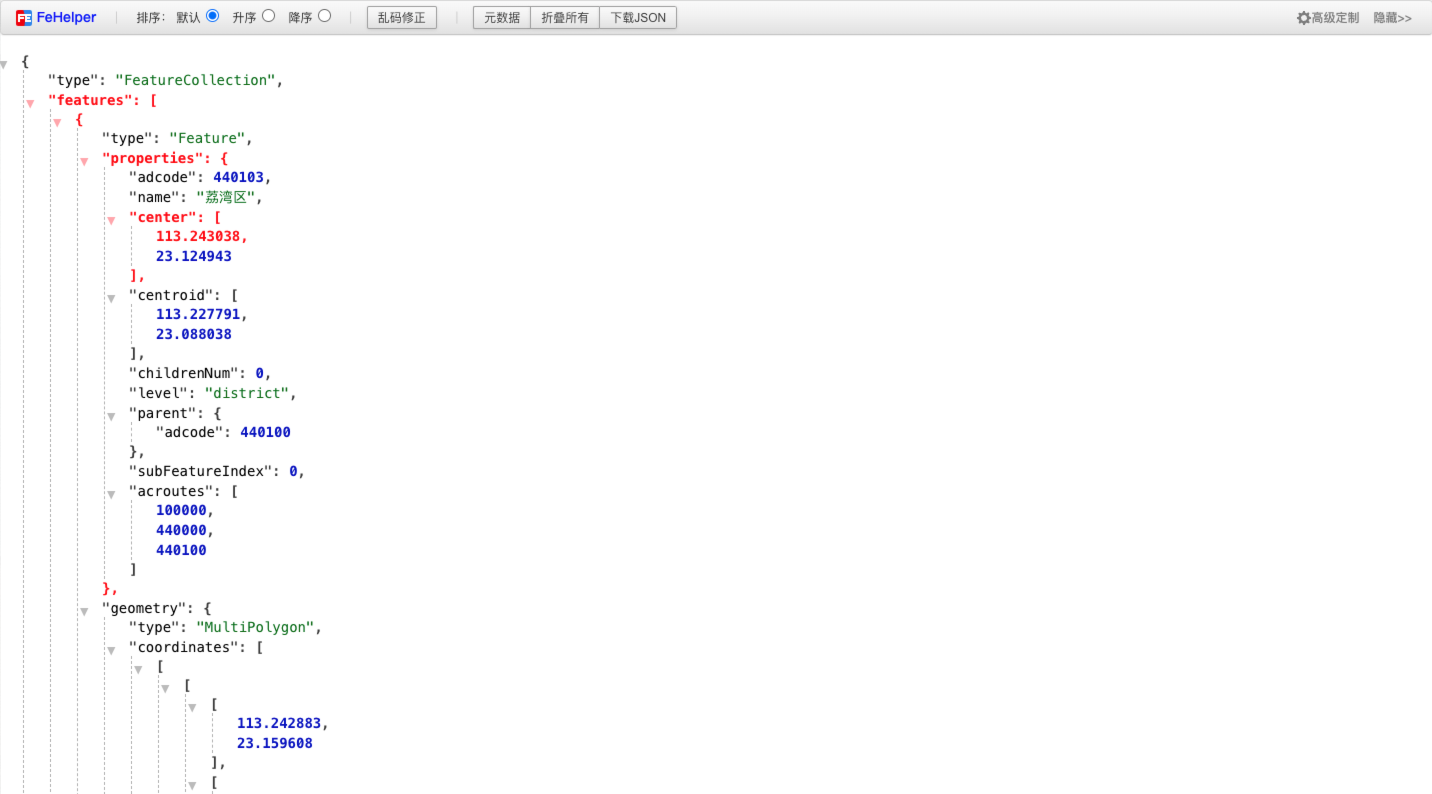
首先,到阿里云提供的地图选择器网站选择想要下载的行政区(http://datav.aliyun.com/portal/school/atlas/area_selector), 网站提供的是 json 格式数据,也就是 GeoJson 格式的多边形地理空间数据。如下:
2、代码实现
思路:
- 页面获取并解析 Geojson 文件,为了让地图能充满指定区域,需要计算一下地图的包围盒范围并计算中心点经纬度,并且计算地图的缩放系数。
- 遍历地图文件数据,将经纬度坐标转换为屏幕坐标,结合 Canvas 绘制多边形相关 api,根据缩放系数将位置信息映射在画布上。
- 响应鼠标事件处理,针对 Canvas 来说,其实就是重绘。这里主要用到了两个api——
isPointInPath或isPointInStroke判断鼠标点击或悬浮区域是否在指定的区域上。
html
<canvas id="container"></canvas>
css
* {
    margin: 0;
    padding: 0;
}

html,
body {
    width: 100%;
    height: 100%;
}

canvas {
    display: block;
    width: 100%;
    height: 100%;
}
js
let canvas = document.querySelector('#container')
let canvasW = canvas.width = window.innerWidth
let canvasH = canvas.height = window.innerHeight
let geoCenterX = 0, geoCenterY = 0  // 地图区域的经纬度中心点
let scale = 1   // 地图缩放系数
let geoData = []
let offsetX = 0, offsetY = 0    // 鼠标事件的位置信息
let eventType = ''  // 事件类型
let ctx = canvas.getContext('2d')

// 地图绘制入口方法
function init() {
    let request = new XMLHttpRequest()
    request.open('get', 'https://geo.datav.aliyun.com/areas_v3/bound/410000_full.json')
    //request.open('get', './henan.json')
    request.send()
    request.onload = function () {
        if (request.status === 200) {
            geoData = JSON.parse(request.responseText)
            getBoxArea()
            drawMap()
        }
    }
}

// 分三步,清空画布、绘制地图各子区域、标注城市名称
function drawMap() {
    ctx.clearRect(0, 0, canvasW, canvasH)
    // 画布背景
    ctx.fillStyle = '#000'
    ctx.fillRect(0, 0, canvasW, canvasH)
    drawArea()
    drawText()
}

// 绘制地图各子区域
function drawArea() {
    let dataArr = geoData.features
    let cursorFlag = false
    for (let i = 0; i < dataArr.length; i++) {
        let centerX = canvasW / 2
        let centerY = canvasH / 2
        dataArr[i].geometry.coordinates.forEach(area => {
            ctx.save()
            ctx.beginPath()
            ctx.translate(centerX, centerY)
            area[0].forEach((elem, index) => {
                let position = toScreenPosition(elem[0], elem[1])
                if (index === 0) {
                    ctx.moveTo(position.x, position.y)
                } else {
                    ctx.lineTo(position.x, position.y)
                }
            })
            ctx.closePath()
            ctx.strokeStyle = '#00cccc'
            ctx.lineWidth = 1
            // 将鼠标悬浮的区域设置为橘黄色
            if (ctx.isPointInPath(offsetX, offsetY)) {
                cursorFlag = true
                ctx.fillStyle = 'orange'
                if (eventType === 'click') {
                    console.log(dataArr[i])
                }
            } else {
                ctx.fillStyle = '#004444'
            }
            ctx.fill()
            ctx.stroke()
            ctx.restore()
        });
        // 动态设置鼠标样式
        if (cursorFlag) {
            canvas.style.cursor = 'pointer'
        } else {
            canvas.style.cursor = 'default'
        }
    }
}
// 标注地图上的城市名称
function drawText() {
    let centerX = canvasW / 2
    let centerY = canvasH / 2
    geoData.features.forEach(item => {
        ctx.save()
        ctx.beginPath()
        ctx.translate(centerX, centerY) // 将画笔移至画布的中心
        ctx.fillStyle = '#fff'
        ctx.font = '16px Microsoft YaHei'
        ctx.textAlign = 'center'
        ctx.textBaseLine = 'center'
        let x = 0, y = 0
        //  因不同的geojson文件中中心点属性信息不同,这里需要做兼容性处理
        if (item.properties.cp) {
            x = item.properties.cp[0]
            y = item.properties.cp[1]
        } else if (item.properties.centroid) {
            x = item.properties.centroid[0]
            y = item.properties.centroid[1]
        } else if (item.properties.center) {
            x = item.properties.center[0]
            y = item.properties.center[1]
        }
        let position = toScreenPosition(x, y)
        ctx.fillText(item.properties.name, position.x, position.y);
        ctx.restore()
    })
}

// 将经纬度坐标转换为屏幕坐标
function toScreenPosition(horizontal, vertical) {
    return {
        x: (horizontal - geoCenterX) * scale,
        y: (geoCenterY - vertical) * scale
    }
}

// 获取包围盒范围,计算包围盒中心经纬度坐标,计算地图缩放系数
function getBoxArea() {
    let N = -90, S = 90, W = 180, E = -180
    geoData.features.forEach(item => {
        // 将MultiPolygon和Polygon格式的地图处理成统一数据格式
        if (item.geometry.type === 'Polygon') {
            item.geometry.coordinates = [item.geometry.coordinates]
        }
        // 取四个方向的极值
        item.geometry.coordinates.forEach(area => {
            let areaN = - 90, areaS = 90, areaW = 180, areaE = -180
            area[0].forEach(elem => {
                if (elem[0] < W) {
                    W = elem[0]
                }
                if (elem[0] > E) {
                    E = elem[0]
                }
                if (elem[1] > N) {
                    N = elem[1]
                }
                if (elem[1] < S) {
                    S = elem[1]
                }
            })
        })
    })
    // 计算包围盒的宽高
    let width = Math.abs(E - W)
    let height = Math.abs(N - S)
    let wScale = canvasW / width
    let hScale = canvasH / height
    // 计算地图缩放系数
    scale = wScale > hScale ? hScale : wScale
    // 获取包围盒中心经纬度坐标
    geoCenterX = (E + W) / 2
    geoCenterY = (N + S) / 2
}

// 滚轮缩放事件
canvas.addEventListener('mousewheel', function (event) {
    if (event.deltaY > 0) {
        if (scale > 10) {
            scale -= 10
        }
    } else {
        scale += 10
    }
    eventType = 'mousewheel'
    drawMap()
})

// 鼠标移动事件
canvas.addEventListener('mousemove', function (event) {
    offsetX = event.offsetX
    offsetY = event.offsetY
    eventType = 'mousemove'
    drawMap()
})

// 鼠标点击事件
canvas.addEventListener('click', function (event) {
    offsetX = event.offsetX
    offsetY = event.offsetY
    eventType = 'click'
    drawMap()
})

init()以上代码实现了一个简易版的 Canvas 地图功能,为增加代码的复用性,实现钻取地图,我们可以在此基础上进行优化升级,封装一个Canvas的工具类,具体代码如下:
js
class CanvasMap {
    constructor(options) {
        let { canvas, hoverTips } = this.initDomElement(options.el)
        this.canvas = canvas
        this.el = options.el
        this.hoverTips = hoverTips
        this.canvasW = this.canvas.width = this.el.offsetWidth
        this.canvasH = this.canvas.height = this.el.offsetHeight
        this.geoCenterX = 0         // 地图经度中心点
        this.geoCenterY = 0         // 地图纬度中心点
        this.scale = 1              // 地图缩放系数
        this.geoData = null         // 地图geo数据信息
        this.offsetX = 0
        this.offsetY = 0            // 鼠标事件的位置信息
        this.eventType = ''         // 事件类型
        this.ctx = this.canvas.getContext('2d')
        this.options = this.defaultConfig() // 默认配置项
        this.clickInfo = null       // 点击区域相关信息
        this.hoverInfo = null       // 鼠标悬浮区域信息
        this.alreadyInit = false    // 地图是否初始化完成
        this.callBack = options.callBack ? options.callBack : null  // 回调函数,给实例对象发送消息
        this.visitInfos = []        // 下钻信息
        this.initMouseEvent()
    }
    // 初始化dom节点-创建画图和提示信息
    initDomElement(el) {
        let canvas = document.createElement('canvas')
        this.setStyle(el, { position: 'relative' })
        this.setStyle(canvas, { display: 'block', width: '100%', height: '100%', cursor: 'pointer' })
        let hoverTips = document.createElement('div')
        el.appendChild(canvas)
        el.appendChild(hoverTips)
        return { canvas, hoverTips }
    }
    // 初始化各类鼠标事件
    initMouseEvent() {
        // 滚轮缩放事件
        this.canvas.onmousewheel = event => {
            if (!this.alreadyInit) return
            this.eventType = 'wheel'
            if (event.deltaY > 0) {
                if (this.scale > 10) {
                    this.scale -= 10
                }
            } else {
                this.scale += 10
            }
            this.drawMap()
        }
        // 鼠标移动事件
        this.canvas.onmousemove = event => {
            if (!this.alreadyInit) return
            this.hoverInfo = null
            this.offsetX = event.offsetX
            this.offsetY = event.offsetY
            this.eventType = 'mousemove'
            this.drawMap()
            this.showHoverTip()
        }
        // 鼠标点击事件
        this.canvas.onclick = event => {
            if (!this.alreadyInit) return
            this.clickInfo = null
            this.offsetX = event.offsetX
            this.offsetY = event.offsetY
            this.eventType = 'click'
            this.drawMap()
            // 地图下钻逻辑
            if (this.clickInfo) {
                // 未下钻到最后一级
                if (this.options.geo.areaCode != this.clickInfo.properties.adcode) {
                    this.options.geo.areaCode = this.clickInfo.properties.adcode
                    this.visitInfos.push(this.clickInfo.properties.parent.adcode)
                    this.getGeoAreas()
                    this.callBack ? this.callBack(this.clickInfo) : ''
                }
            } else {
                let areaCode = this.visitInfos.pop()
                // 返回至初始状态
                if (areaCode) {
                    this.options.geo.areaCode = areaCode
                    this.getGeoAreas()
                    this.callBack ? this.callBack(this.clickInfo) : ''
                }
            }
        }
    }
    // 默认配置参数
    defaultConfig() {
        return {
            grid: {
                backgroundColor: 'transparent', // 地图背景色
            },
            geo: {
                areaCode: "410000",     // 行政单位标识
            },
            itemStyle: {
                areaColor: '#176789',   // 区域颜色
                borderWidth: 1,         // 区域边框线宽度
                borderColor: "#3ed7d5", // 区域边框线颜色
            },
            label: {
                show: true,             // 是否显示行政单位名称
                textStyle: {
                    font: '16px Microsoft YaHei', // 字体
                    color: '#fff',      // 字体颜色
                }
            },
            tooltip: {
                style: {
                    position: 'absolute',
                    display: 'none',
                    whiteSpace: 'nowrap',
                    zIndex: '9999999',
                    transition: 'left 0.4s cubic-bezier(0.23, 1, 0.32, 1) 0s, top 0.4s cubic-bezier(0.23, 1, 0.32, 1) 0s',
                    backgroundColor: 'rgba(50, 50, 50, 0.7)',
                    borderRadius: '4px',
                    border: '0px solid rgb(51, 51, 51)',
                    color: 'rgb(255, 255, 255)',
                    font: '20px / 30px Microsoft YaHei',
                    padding: '5px',
                    left: '0px',
                    top: '0px',
                },
                markerTemplate: '<span style="display: inline-block;width:14px;height: 14px;border-radius: 50%;margin-right: 4px;background-color: #"></span>',
                show: false,
                formatter: function (param) {
                    return `${param.marker}${param.data.name}`
                }
            },
        }
    }
    // 设置个性化地图参数
    setOption(options) {
        let defaultConfig = this.defaultConfig()
        this.options = this.deepCopy(defaultConfig, typeof options === 'object' ? options : {})
        this.setStyle(this.hoverTips, this.options.tooltip.style)   // 悬浮提示信息样式
        this.getGeoAreas()
    }
    // 抓取地图geojson格式数据
    getGeoAreas() {
        let request = new XMLHttpRequest()
        let areaCode = this.options.geo.areaCode.toString()
        // 阿里云地图服务-县级地图(只有边界)与其他层级接口路径稍微有出入,需特殊处理
        if (areaCode.substr(-2) == '00') {
            areaCode = `${areaCode}_full`
        }
        request.open('get', `https://geo.datav.aliyun.com/areas_v3/bound/${areaCode}.json`)
        request.send()
        request.onload = () => {
            if (request.status === 200) {
                this.geoData = JSON.parse(request.responseText)
                this.getBoxArea()
                this.drawMap()
            }
        }
    }
    // 获取包围盒范围,计算包围盒中心经纬度坐标,计算地图缩放系数
    getBoxArea() {
        let N = -90, S = 90, W = 180, E = -180
        this.geoData.features.forEach(item => {
            // 将MultiPolygon和Polygon格式的地图处理成统一数据格式
            if (item.geometry.type === 'Polygon') {
                item.geometry.coordinates = [item.geometry.coordinates]
            }
            // 取四个方向的极值
            item.geometry.coordinates.forEach(area => {
                area[0].forEach(elem => {
                    if (elem[0] < W) {
                        W = elem[0]
                    }
                    if (elem[0] > E) {
                        E = elem[0]
                    }
                    if (elem[1] > N) {
                        N = elem[1]
                    }
                    if (elem[1] < S) {
                        S = elem[1]
                    }
                })
            })
        })
        // 计算包围盒的宽高
        let width = Math.abs(E - W)
        let height = Math.abs(N - S)
        let wScale = this.canvasW / width
        let hScale = this.canvasH / height
        // 计算地图缩放系数
        this.scale = wScale > hScale ? hScale : wScale
        // 获取包围盒中心经纬度坐标
        this.geoCenterX = (E + W) / 2
        this.geoCenterY = (N + S) / 2
    }
    // 分三步,清空画布、绘制地图各子区域、标注城市名称
    drawMap() {
        this.alreadyInit = false
        this.ctx.clearRect(0, 0, this.canvasW, this.canvasH)
        this.ctx.fillStyle = this.options.grid.backgroundColor  // 图表背景色
        this.ctx.fillRect(0, 0, this.canvasW, this.canvasH)
        this.drawArea()
        this.drawText()
        this.alreadyInit = true
    }
    // 绘制地图各子区域
    drawArea() {
        let dataArr = this.geoData.features
        for (let i = 0; i < dataArr.length; i++) {
            let centerX = this.canvasW / 2
            let centerY = this.canvasH / 2
            dataArr[i].geometry.coordinates.forEach(area => {
                this.ctx.save()
                this.ctx.beginPath()
                this.ctx.translate(centerX, centerY)
                area[0].forEach((elem, index) => {
                    let position = this.toScreenPosition(elem[0], elem[1])
                    if (index === 0) {
                        this.ctx.moveTo(position.x, position.y)
                    } else {
                        this.ctx.lineTo(position.x, position.y)
                    }
                })
                this.ctx.closePath()
                let { areaColor, borderWidth, borderColor } = this.options.itemStyle
                this.ctx.strokeStyle = borderColor
                this.ctx.lineWidth = borderWidth
                // 将鼠标悬浮的区域设置为橘黄色
                if (this.ctx.isPointInPath(this.offsetX, this.offsetY)) {
                    this.ctx.fillStyle = 'orange'
                    if (this.eventType === 'click') {
                        this.clickInfo = dataArr[i]
                    } else if (this.eventType === 'mousemove') {
                        this.hoverInfo = dataArr[i]
                    }
                } else {
                    this.ctx.fillStyle = areaColor
                }
                this.ctx.fill()
                this.ctx.stroke()
                this.ctx.restore()
            });
        }
    }
    // 标注地图上的城市名称
    drawText() {
        if (!this.options.label.show) return
        let centerX = this.canvasW / 2
        let centerY = this.canvasH / 2
        let { font, color } = this.options.label.textStyle
        this.geoData.features.forEach(item => {
            this.ctx.save()
            this.ctx.beginPath()
            this.ctx.translate(centerX, centerY) // 将画笔移至画布的中心
            this.ctx.fillStyle = color
            this.ctx.font = font
            this.ctx.textAlign = 'center'
            this.ctx.textBaseLine = 'center'
            let x = 0, y = 0
            //  因不同的geojson文件中中心点属性信息不同,这里需要做兼容性处理
            if (item.properties.cp) {
                x = item.properties.cp[0]
                y = item.properties.cp[1]
            } else if (item.properties.centroid) {
                x = item.properties.centroid[0]
                y = item.properties.centroid[1]
            } else if (item.properties.center) {
                x = item.properties.center[0]
                y = item.properties.center[1]
            }
            let position = this.toScreenPosition(x, y)
            this.ctx.fillText(item.properties.name, position.x, position.y);
            this.ctx.restore()
        })
    }
    // 将经纬度坐标转换为屏幕坐标
    toScreenPosition(horizontal, vertical) {
        // 屏幕坐标系y轴与地图坐标系y轴相反,y轴坐标取反
        return {
            x: (horizontal - this.geoCenterX) * this.scale,
            y: (this.geoCenterY - vertical) * this.scale
        }
    }
    // 窗口大小发生变化时重绘地图方法
    resize() {
        if (!this.alreadyInit) return
        this.canvasW = this.canvas.width = this.el.offsetWidth
        this.canvasH = this.canvas.height = this.el.offsetHeight
        this.getBoxArea()
        this.drawMap()
    }
    // 鼠标悬浮提示信息
    showHoverTip() {
        if (this.hoverInfo) {
            // 处理提示信息
            this.hoverTips.innerHTML = this.options.tooltip.formatter({
                marker: this.options.tooltip.markerTemplate.replace('#', this.options.itemStyle.areaColor),
                color: '#fff',
                data: { name: this.hoverInfo.properties.name, ...this.hoverInfo }
            })
            // 确定鼠标悬浮位置信息(防止重合,与鼠标着落点偏移20px)
            let tipsPosX = 0
            let tipsPosY = 0
            // 提示信息超出盒子特殊处理
            if (this.offsetX + this.hoverTips.offsetWidth + 20 > this.canvasW) {
                tipsPosX = this.offsetX - 20 - this.hoverTips.offsetWidth
            } else {
                tipsPosX = this.offsetX + 20
            }
            if (this.offsetY + this.hoverTips.offsetHeight + 20 > this.canvasH) {
                tipsPosY = this.offsetY - 20 - this.hoverTips.offsetHeight
            } else {
                tipsPosY = this.offsetY + 20
            }
            this.setStyle(this.hoverTips, { display: 'block', left: `${tipsPosX}px`, top: `${tipsPosY}px` })
        } else {
            this.setStyle(this.hoverTips, { display: 'none' })
        }
    }
    // 深拷贝
    deepCopy(result, obj) {
        for (var key in obj) {
            if (obj.hasOwnProperty(key)) {
                if (typeof obj[key] === 'object' && result[key]) {
                    this.deepCopy(result[key], obj[key]);
                } else {
                    result[key] = obj[key];
                }
            }
        }
        return result;
    }
    // 批量设置样式
    setStyle(obj, sty) {
        for (let key in sty) {
            obj.style[key] = sty[key]
        }
    }
}
export default CanvasMap在 Vue 组件使用
html
import CanvasMap from "./map.js";
mounted() {
    this.myChart1 = new CanvasMap({
        el: this.$refs.mapbox1,
        callBack: (message) => { console.log(message) }	 // 接收地图事件消息
    });
    this.myChart1.setOption({tooltip:{}, geo: {}, itemStyle: {}});
}
// html使用
var myChart1 = new CanvasMap({
    el: document.getElementById('mapbox1'),
    callBack: (message) => { console.log(message) }	 // 接收地图事件消息
});
myChart1.setOption({tooltip:{}, geo: {}, itemStyle: {}});评论
0 条—
还没有评论,来说第一句