Mac m1 使用 Prometheus 监控 Mysql 数据库 -- mysqld-exporter
AI 摘要salmon-ai
本文详细解析了在 Mac M1 环境下使用 Prometheus 结合 mysqld-exp
简介
mysqld-exporter 是常用的数据库监控工具,用来收集 MySQL 或者 Mariadb 数据库相关指标,mysqld-exporter 需要连接到数据库并有相关权限。
这个是官方项目地址:https://github.com/prometheus/mysqld_exporter
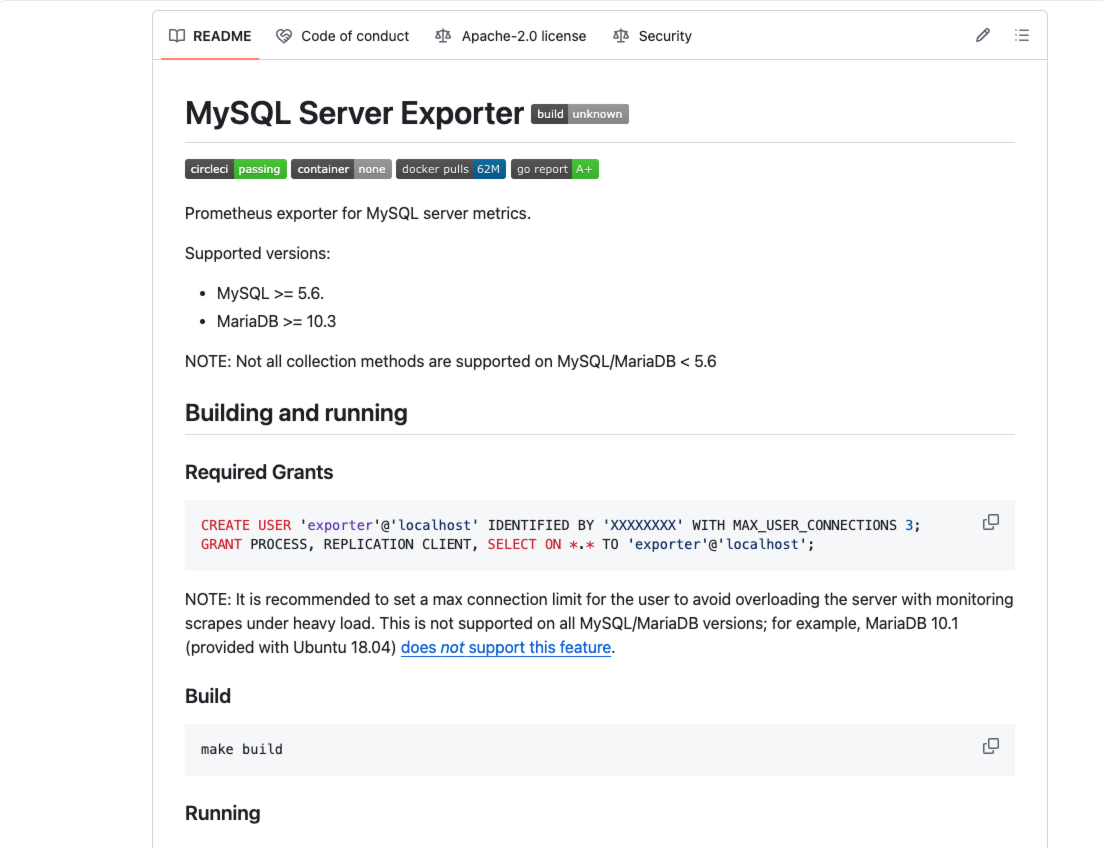
文档里已经描述了使用的方法与注意事项,本文我将通过 Docker 容器化部署的方式部署 mysqld-exporter。
教程
1、拉取镜像
mysqld-exporter:用于MySQL数据库数据收集;
sh
docker pull prom/mysqld-exporter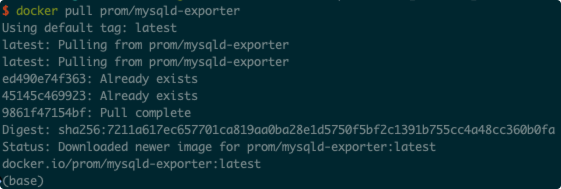
2、数据库授权
sql
-- 允许本地主机访问
CREATE USER 'exporter'@'localhost' IDENTIFIED BY '123456' WITH MAX_USER_CONNECTIONS 3;
GRANT PROCESS, REPLICATION CLIENT, SELECT ON *.* TO 'exporter'@'localhost';

--  允许 mysqld-exporter 主机访问
CREATE USER 'exporter'@'172.17.0.9' IDENTIFIED BY '123456' WITH MAX_USER_CONNECTIONS 3;
GRANT PROCESS, REPLICATION CLIENT, SELECT ON *.* TO 'exporter'@'172.17.0.9';
3、运行容器
启动 mysqld-exporter,这里我踩坑了,遇到了几种错误,如:
Error parsing host config" file=.my.cnf err="no configuration found"Error parsing host config" file=/root/.my.cnf err="failed to load /root/.my.cnf: open /root/.my.cnf: permission denied
功夫不负有心人,终于经过一步一步排查错误,修改运行命令,成功运行,启动无报错。
首先我们在本地创建一个文件 .my.cnf
sh
/opt/docker/mysql-exporter/.my.cnf内容
ini
[client]
host=172.17.0.3
port=3306
user=exporter
password=123456
运行容器
sh
docker run -d --name mysqld_exporter \
-p 9104:9104 \
-v /opt/docker/mysql-exporter/.my.cnf:/usr/.my.cnf \
-e DATA_SOURCE_NAME="exporter:123456@(172.17.0.3:3306)/" \
prom/mysqld-exporter \
--config.my-cnf=/usr/.my.cnf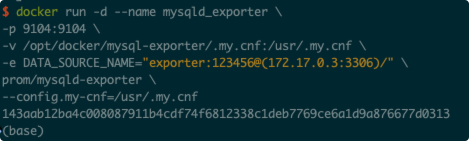
4、对接 Prometheus
修改 prometheus.yml
yml
global:
  scrape_interval:     60s
  evaluation_interval: 60s

scrape_configs:
  - job_name: 'prometheus'
    static_configs:
      - targets: ['localhost:9090']
        labels:
          instance: prometheus
  # 收集主机的监控数据
  - job_name: 'MacBook Pro'
    static_configs:
      - targets: ['172.17.0.5:9100']
        labels:
          instance: localhost
  # 收集cadvisor的监控数据
  - job_name: 'cadvisor'
    static_configs:
      - targets: ["172.17.0.8:8080"]
        labels:
          instance: cAdvisor
  # 收集MySQL的监控数据
  - job_name: 'mysql-exporter'
    static_configs:
      - targets: ['172.17.0.9:9104']
        labels:
instance: mysql-exporter热更新配置
sh
curl -X POST http://localhost:9090/-/reload打开 Prometheus 控制台,可以看到我们的 mysql 数据监控已经启动成功了
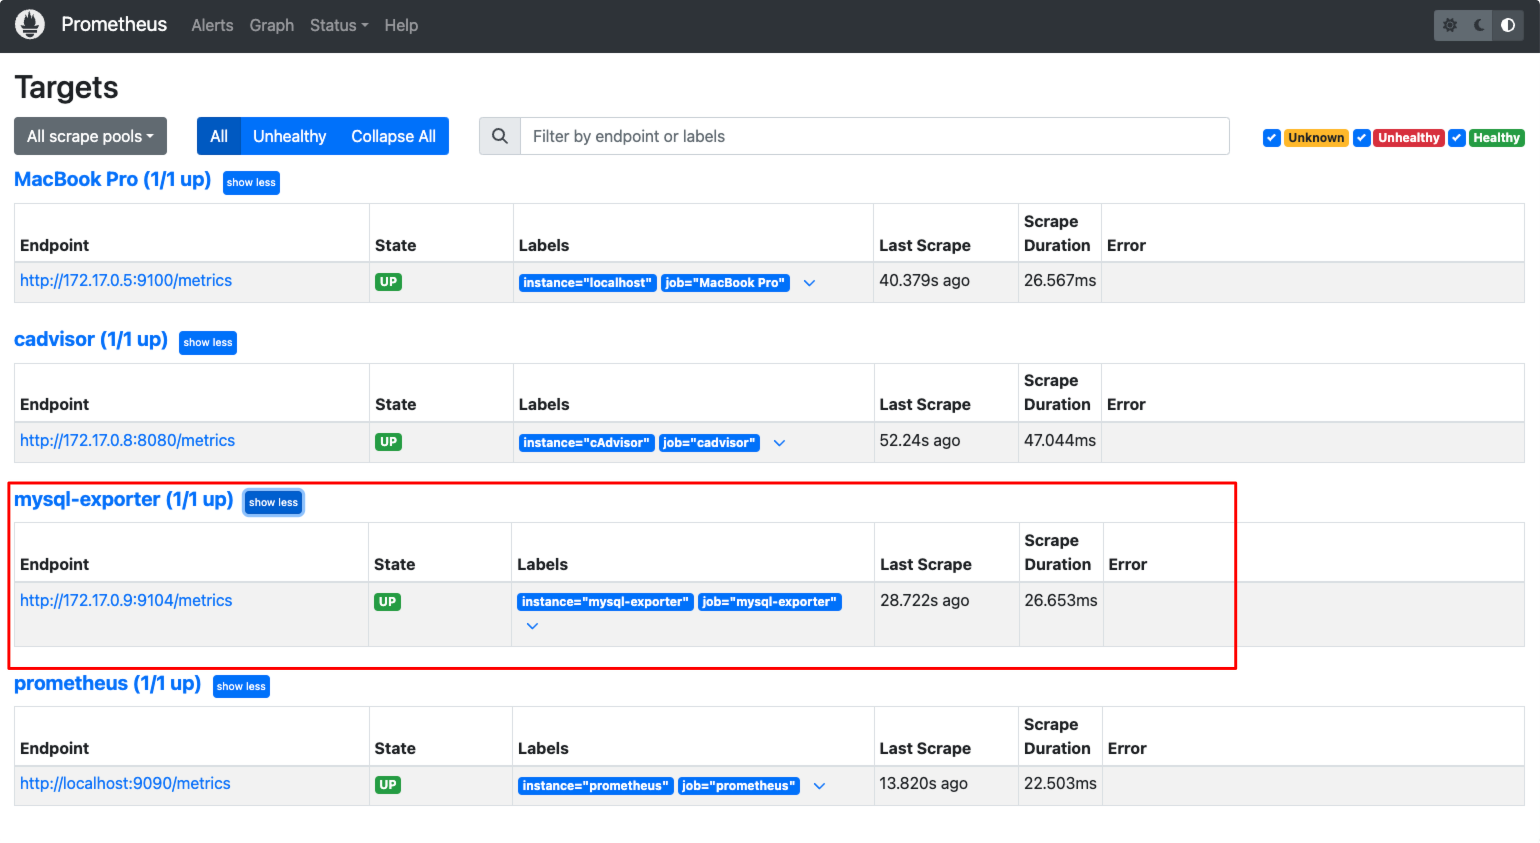
5、使用 Grafana 仪表盘展示监控数据
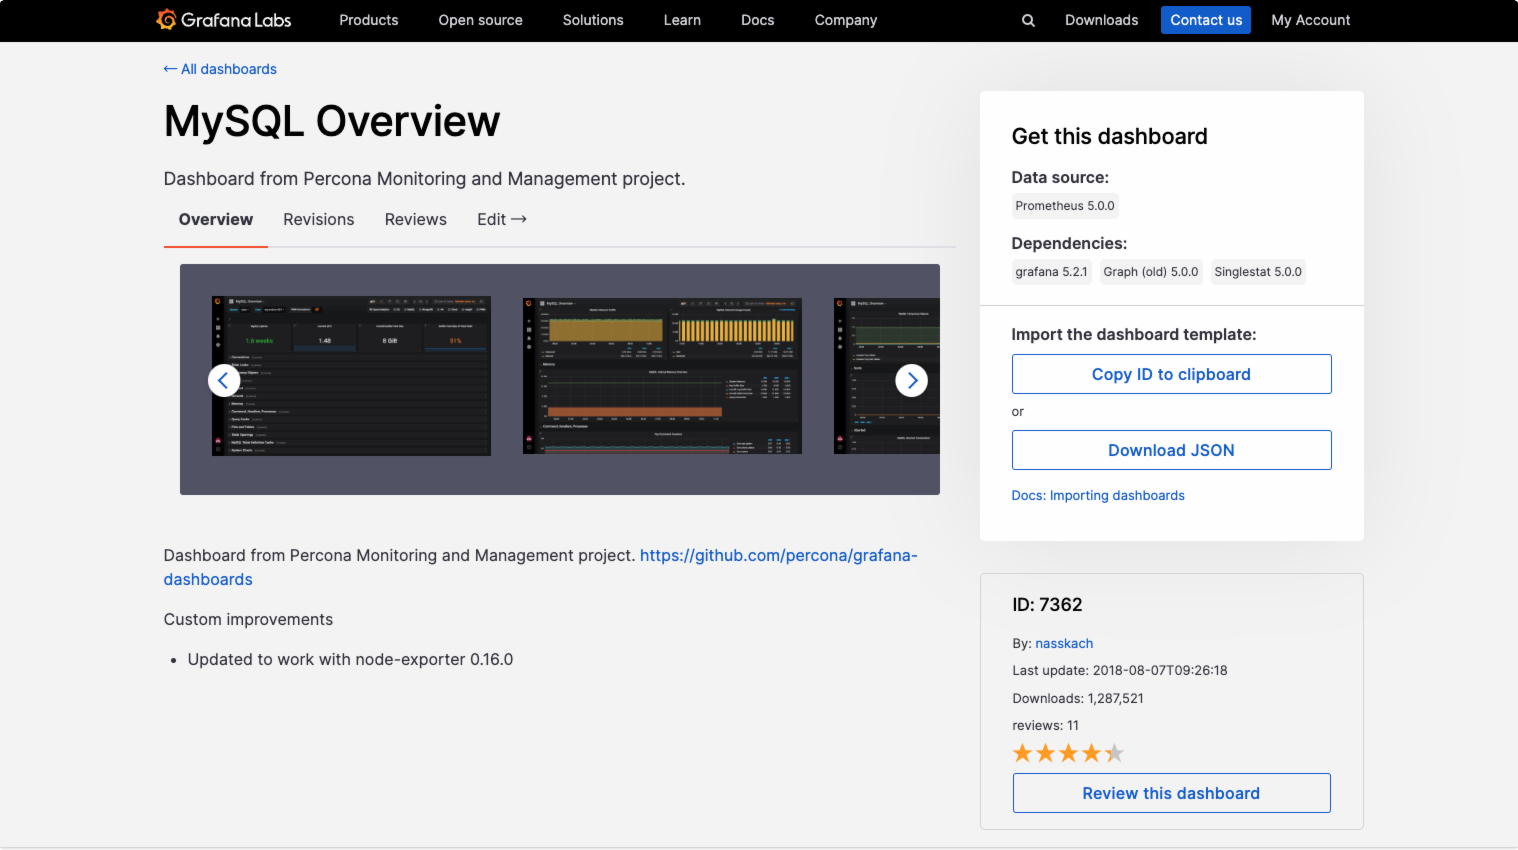
这里我找到了一个下载数与评分都挺高的仪表盘模版
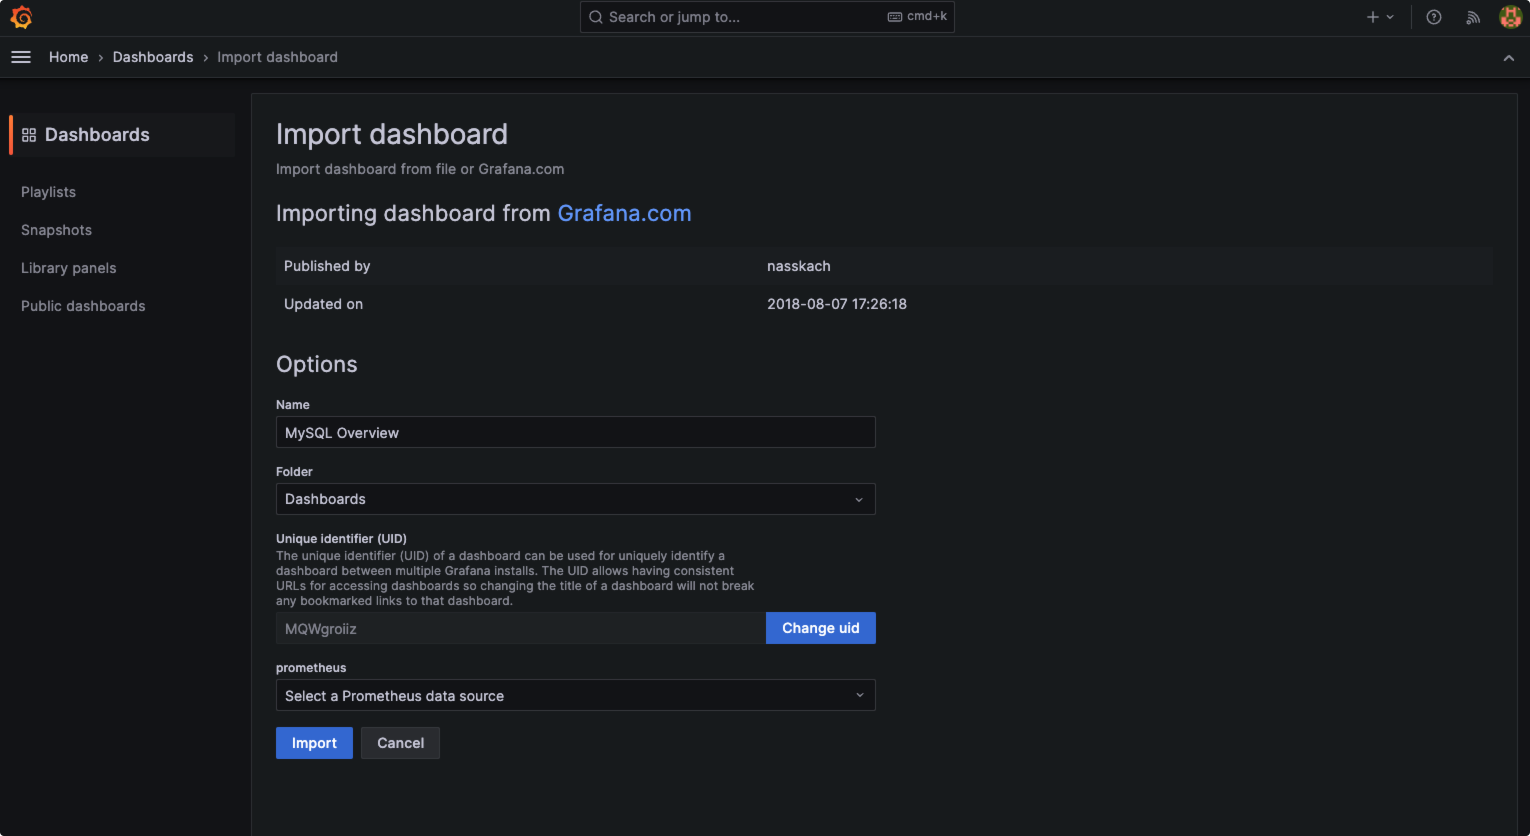
我们将其导入,数据源我们选择 Prometheus
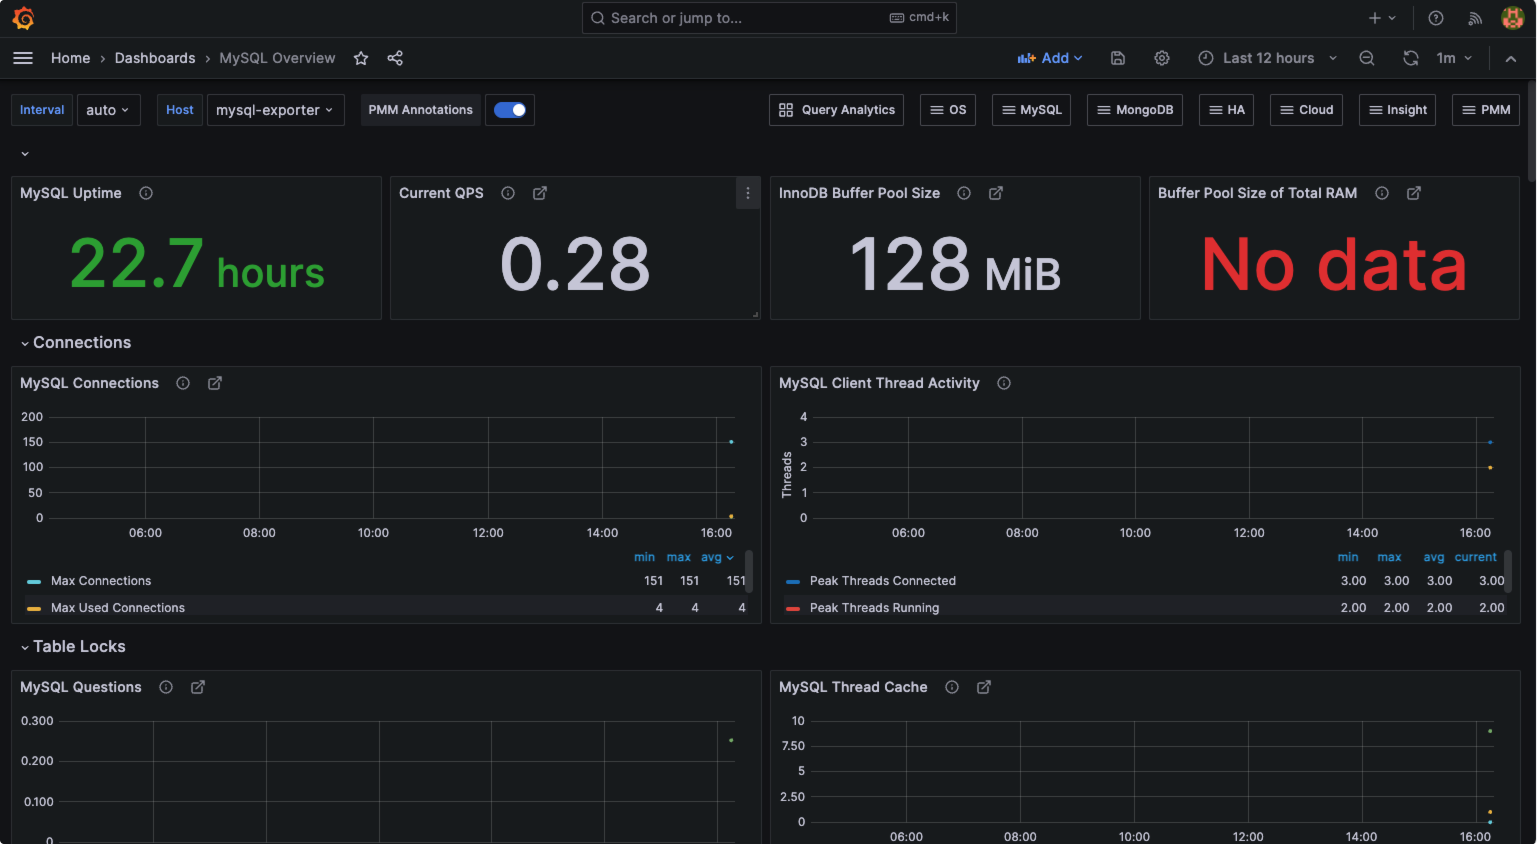
最终效果
评论
0 条—
还没有评论,来说第一句